Flood recovery program for water quality monitoring - east coast project dashboard
This dashboard is a key resource developed through the East Coast Flood Recovery Project that provides access to water quality data.
Through comprehensive monitoring and real time data capture, the project is building a picture of how water quality is recovering in waterways that were significantly impacted by the 2022 floods.
Data available in the dashboard
The data available on the dashboard collates multiple water quality parameters from thousands of samples collected throughout the project, including water clarity (turbidity), algae (chlorophyll-a), nutrients and bacteria. This data has been collected through manual field sampling by the project team and in real-time via telemetered water quality loggers (2 land-based sites and 6 smart buoys).
These 8 loggers were installed through the project to measure real-time data every 15 minutes across 6 waterways. The dashboard also includes real-time data from an additional 10 loggers located across NSW that contribute water quality data to other NSW Department of Planning and Environment (DPE) monitoring programs.
Click the 'Real-time data' tab on the left menu in the dashboard to find out where the loggers are located and access the real-time data.
Scroll through the North Coast, Mid Coast and Hawkesbury-Nepean tabs on the left menu to view the data from monthly water quality samples collected since the 2022 flood events.
Water quality grades
We have used data collected through the project to assess water quality through the development of a grading system. Water quality monitoring results have been used to grade water quality at sites within waterways from ‘Very Good’ to ‘Very Poor,’ as indicated in the legend below.
| Water quality grade | % guideline value exceedance |
|---|---|
| NA | No data available |
| Very Good | Equal to 0% |
| Good | less than or equal to (≤) 25% |
| Fair | ≤ 50% |
| Poor | ≤ 75% |
| Very Poor | ≤ 100% |
Grades are determined by the percentage of water sample results above the guideline value for each parameter; known as the guideline value exceedence.
These guideline values come from the best available guidelines at the time and are used to identify water quality thresholds for physical and chemical water quality parameters in different waterways. Links to these guidelines can be found in the 'Useful links' section of this page.
We have used 5 water quality parameters to determine grades for the dashboard. These are:
Example of grade calculation using the Most Recent category:
The most recent monthly results for water clarity and bacteria levels exceeded the guideline value but algae, nitrogen and phosphorus levels were below the guideline value. Therefore, the average percentage of exceedances across these parameters is 40% resulting in an overall site grade of “Fair”.
| Parameter | Guideline value exceedance | % exceedances | Grade |
|---|---|---|---|
| Overall (Site grade) | 40% | Fair | |
| Water clarity | Yes | 100% | Very Poor |
| Algae | Yes | 100% | Very Poor |
| Total nitrogen | No | 0% | Very Good |
| Total phosphorus | No | 0% | Very Good |
| Bacteria | No | 0% | Very Good |
Water quality grades for individual sites can be viewed on the dashboard by hovering over site markers (below) or by selecting the parameter icon (above) from the dashboard side bar.
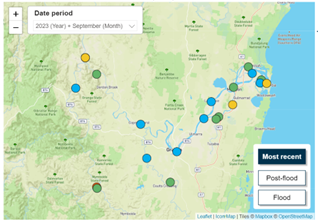
For each site, you can also view the water quality grade at different points in time from September 2022 to the most recent data sing the date menu in the top corner of the map.
Most recent
This filter displays water quality grades using the most recent samples analysed through the project. The process of sampling, analysis, and reporting on the dashboard takes around six weeks. You can view the most recent sampling date by hovering over the site marker.
Post-flood
This filter displays water quality grades using all samples analysed in the project since the 2022 flood event. You can view the date ranges of the post-flood period by hovering over the site markers.
Flood
This filter displays water quality grades following the most recent flood event that has occurred after the 2022 flood event. For this project, a ‘flood event’ occurs when water levels in a catchment exceed the minor flood threshold of the Bureau of Meteorology’s (BoM) flood warning gauges.
Water clarity (Turbidity)
Flooding readily transports material from land into waterways and disturbs riverbeds. This process decreases water clarity due to the presence of tiny, suspended particles such as silt and microalgae. Turbidity is the measurement of suspended solids in water, with high levels negatively impacting water quality by reducing sunlight penetration into the water column, which hinders the growth of important ecological values such as seagrass.
Algae (Chlorophyll-a)
Chlorophyll a gives algae their green colour and enables them to convert sunlight into food, and it can be used to measure the amount of algae growing in the water.
Concentrations are often higher after rainfall. Rain and flooding can flush nutrients into the water. Higher levels are also common during the summer months coinciding with higher water temperatures and light levels.
Algae is important in sustaining the food web however high levels and algal blooms can be harmful to human and aquatic health.
Total nitrogen (Nitrogen)
Total nitrogen is an essential nutrient for plants and animals, however high levels in waterways can be harmful to the environment. High rainfall and flooding can increase nitrogen levels in waterways through run-off and leaching from a number of sources including fertiliser, wastewater treatment, animal manure and failing septic systems.
Excess amounts of nitrogen in waterways can cause spikes in plant and algal growth and as these plants and algae decay, they are consumed by bacteria which use up oxygen in the water column and reduces oxygen availability for other aquatic organisms such as fish.
Total phosphorus (Phosphorus)
Phosphorous is another essential plant nutrient that can enter waterways in the same way and have similar impacts on the waterways as high nitrogen. Phosphorus and nitrogen behave differently in soils and levels of these two nutrients in the water often differ as a result. Using both parameters in the project provides more accurate assessments of water quality.
Bacteria (Faecal Indicator Bacteria)
Enterococci and E. coli are two types of faecal indicator bacteria that are present in human and animal waste, and in sewage overflows from treatment plants and sewer networks during floods. Faecal contamination is a key parameter of water quality because it can pose direct risks to human and animal health.
- While faecal indicator bacteria is one of the parameters used for water quality grading, the information in this dashboard is not direct health advice.
- The water quality gradings are not real-time.
- Real-time data from the telemetered buoys is live and has not been quality controlled. This data does not contribute to the water quality grades.
More information
For more information about the dashboard, or the project, contact the project team at [email protected].
Useful links
- ANZECC Water Quality Guidelines
- NHMRC Recreational Water Guidelines
- Beachwatch reporting and forecasts
- WaterNSW Continuous Water Monitoring Network
- Manly Hydraulics Laboratory
- Floods Near Me NSW portal
- Bureau of Meteorology Recent Rainfall
- Bureau of Meteorology climate change data
- Bureau of Meteorology water data
- Flood Knowledge Centre (bom.gov.au)