Quarterly results October to December 2024
In response to flooding events and fish deaths in March 2023, the EPA, in partnership with the NSW Department of Climate Change, Energy, the Environment and Water (DCCEEW), is monitoring the health of the Darling-Baaka River.
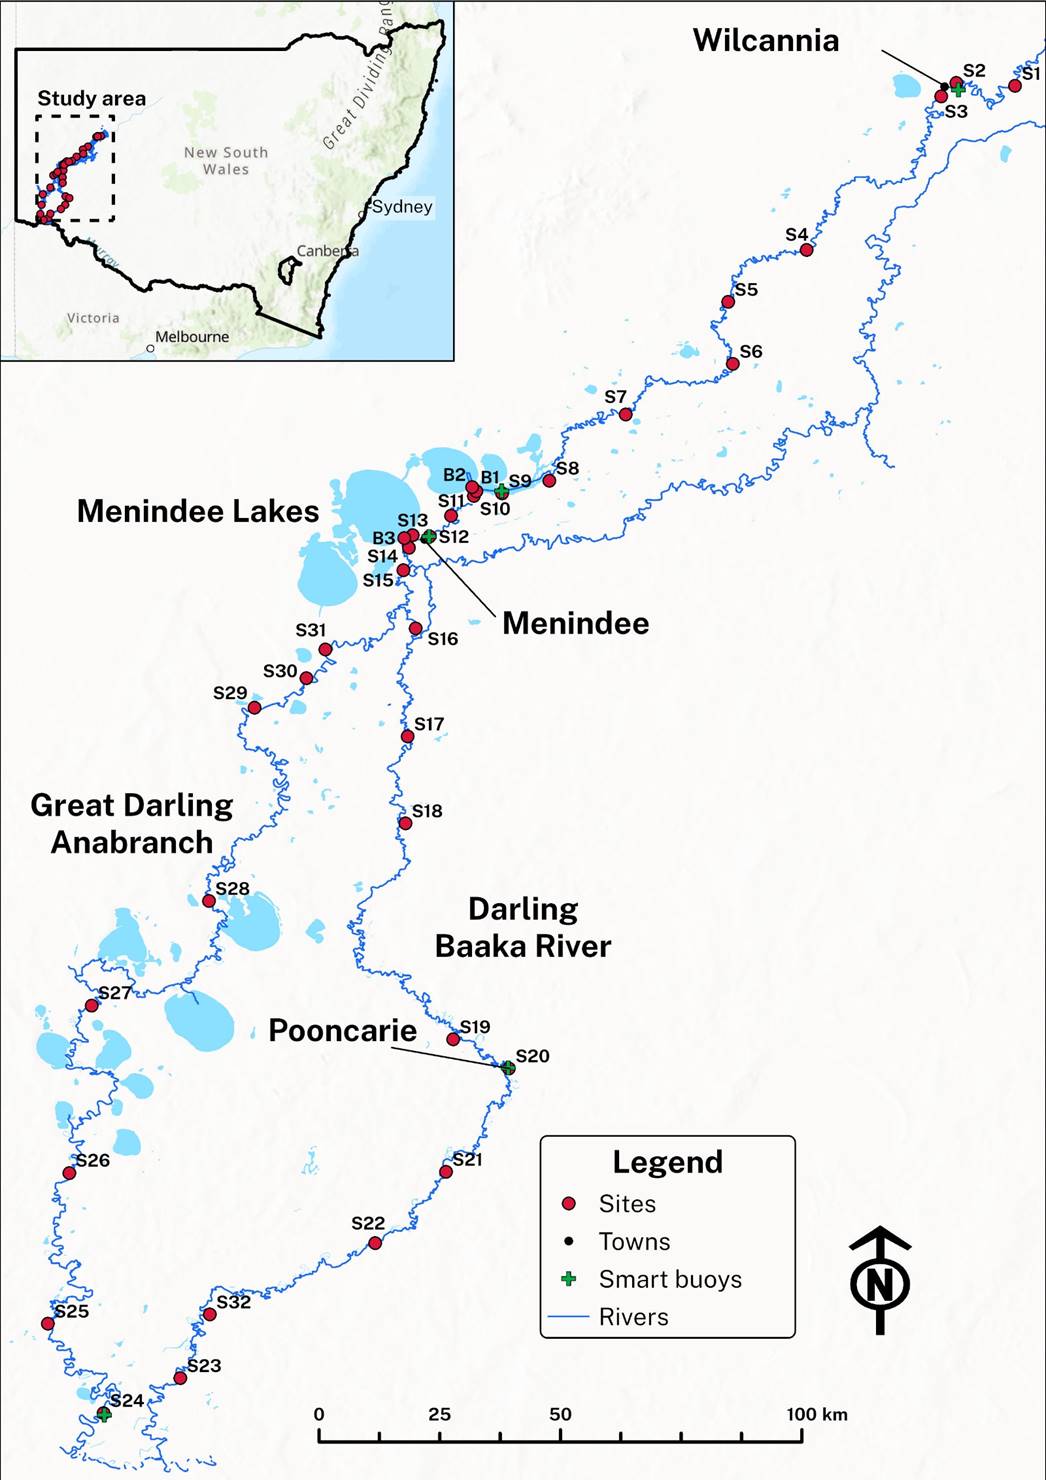
This report provides the monitoring results between October and December 2024. Monthly water samples were collected from 35 sites (see map below) and measured for:
- Temperature
- Dissolved oxygen
- Nutrients
- PH
- Chlorophyll-a
- Algae
- Metals
- Pesticides
Five smart buoys recorded water quality every 30 minutes.
Guidelines used in this report
The South-Central Australia guidelines of ANZECC, 2000 are used for this project. In absence of chlorophyll-a measurements in these guidelines, South East Australian guidelines have been used. For pesticides and metals, guidelines are the 95% species protection level (i.e. the level that protects 95% of species; ANZG, 2020).
Nutrients
Samples showed consistently high levels of total nitrogen (TN) and total phosphorous (TP). On average, TN and TP exceeded these guidelines by up to ~4.3 and 8.1 times, respectively (Table 1). High nutrients levels can lead to algal blooms and may be harmful to animals and humans.
Pesticides and Metals
All pesticide concentrations in water samples were below guideline values. Concentrations of zinc exceeded guideline values at sites S6, S12, and S20. Concentrations of copper exceeded guidelines at sites S7, S15, S17, S21, S22, S23, S25, S26, S28, S32 (Table 1).
Algae
Algal levels were very high in the study area, with all chlorophyll-a concentrations exceeding the 5 µg/L guideline value, ranging from ~8 to 160 µg/L.
Dissolved Oxygen
All dissolved oxygen (DO) levels recorded were within the recommended concentrations for biota (>4mg/L).
Overall assessment
The areas of concern for the current sample period were elevated nutrients and metals. A summary of results is provided in the table below, with full results available for download.
Contact [email protected] for more information.
Table 1
Default guideline values for a 95% level of species protection for toxicants in freshwater ecosystems (ANZG, 2020).
| Toxicant | 95% species protection guideline value |
|---|---|
| Copper | 1.4 µg/L |
| Zinc | 8 µg/L |
Water quality summary October to December 2024
Date 1: 14 October - 17 October Date 2: 10 November - 20 November Date 3: 2 - 13 December
| Sampling site | Dissolved oxygen | Nutrients | Pesticides* | Metals | |||||||||||
|---|---|---|---|---|---|---|---|---|---|---|---|---|---|---|---|
| Date 1 | Date 2 | Date 3 | Date 1 | Date 2 | Date 3 | Date 1 | Date 2 | Date 3 | Date 1 | Date 2 | Date 3 | ||||
| TN | TP | TN | TP | TN | TP | ||||||||||
| S1 | ✓ | ✓ | ✓ | ✓ | |||||||||||
| S2 | ✓ | ✓ | ✕ | ✕ | ✕ | ✕ | ✓ | ✓ | |||||||
| S3 | ✓ | ✓ | ✕ | ✕ | ✓ | ||||||||||
| S4 | ✓ | ✓ | ✓ | ✕ | ✕ | ✕ | ✓ | ✓ | |||||||
| S5 | ✓ | ✓ | ✓ | ✕ | ✓ | ✓ | |||||||||
| S6 | ✓ | ✓ | ✓ | ✕ | ✓ | ✓ | ✓ | ✕ | |||||||
| S7 | ✓ | ✓ | ✓ | ✕ | ✓ | ✓ | ✓ | ✕ | |||||||
| S8 | ✓ | ✕ | ✕ | ✓ | ✓ | ||||||||||
| S9 | ✓ | ✓ | ✕ | ✓ | ✓ | ✓ | ✓ | ||||||||
| S10 | ✓ | ✕ | ✕ | ✕ | ✕ | ||||||||||
| S11 | ✓ | ✓ | ✕ | ✕ | ✕ | ✕ | ✓ | ✓ | |||||||
| S12 | ✓ | ✓ | ✕ | ✕ | ✕ | ✕ | ✓ | ✕ | |||||||
| S13 | ✓ | ✓ | ✕ | ✕ | ✕ | ✕ | |||||||||
| S14 | ✓ | ✕ | ✕ | ✕ | ✕ | ||||||||||
| S15 | ✓ | ✕ | ✕ | ✕ | ✕ | ✕ | |||||||||
| S16 | ✓ | ✕ | ✕ | ✕ | ✕ | ||||||||||
| S17 | ✓ | ✕ | ✕ | ✓ | ✕ | ||||||||||
| S18 | ✓ | ✓ | ✕ | ✕ | ✕ | ✕ | |||||||||
| S19 | ✓ | ✓ | ✕ | ✕ | ✕ | ✕ | |||||||||
| S20 | ✓ | ✓ | ✕ | ✕ | ✕ | ✕ | ✓ | ✕ | |||||||
| S21 | ✓ | ✓ | ✕ | ✕ | ✕ | ✕ | ✕ | ||||||||
| S22 | ✓ | ✓ | ✕ | ✕ | ✕ | ✕ | ✓ | ✕ | |||||||
| S23 | ✓ | ✓ | ✕ | ✕ | ✕ | ✕ | ✓ | ✕ | |||||||
| S24 | ✓ | ✓ | ✕ | ✕ | ✕ | ✕ | ✓ | ✓ | |||||||
| S25 | ✓ | ✓ | ✕ | ✕ | ✕ | ✕ | ✕ | ||||||||
| S26 | ✓ | ✓ | ✕ | ✕ | ✕ | ✕ | ✕ | ||||||||
| S27 | ✓ | ✓ | ✕ | ✕ | ✕ | ✕ | ✓ | ✓ | |||||||
| S28 | ✓ | ✓ | ✕ | ✕ | ✕ | ✕ | ✕ | ||||||||
| S29 | ✓ | ✓ | ✕ | ✕ | ✕ | ✕ | ✓ | ✓ | |||||||
| S30 | ✓ | ✓ | ✕ | ✕ | ✕ | ✕ | |||||||||
| S31 | ✓ | ✕ | ✕ | ||||||||||||
| S32 | ✓ | ✓ | ✕ | ✕ | ✕ | ✕ | ✕ | ||||||||
| B1 | ✓ | ✓ | ✕ | ✕ | ✕ | ✕ | |||||||||
| B2 | ✓ | ✓ | ✕ | ✕ | ✕ | ✕ | |||||||||
| B3 | ✓ | ✓ | ✕ | ✕ | ✕ | ✕ | |||||||||
✓ Meets guidelines ✕ Outside of guidelines
Guidelines used are for lowland river ecosystems in South Central Australia (ANZECC 2000)
* Pesticide results are reported from sediment samples